Monitoring your JHipster Applications
JHipster provides several options to monitor your applications at runtime.
Generated dashboards
For monoliths and gateways, JHipster generates several dashboards to monitor each application. Those dashboards are available at runtime, and are the easiest way to do some monitoring.
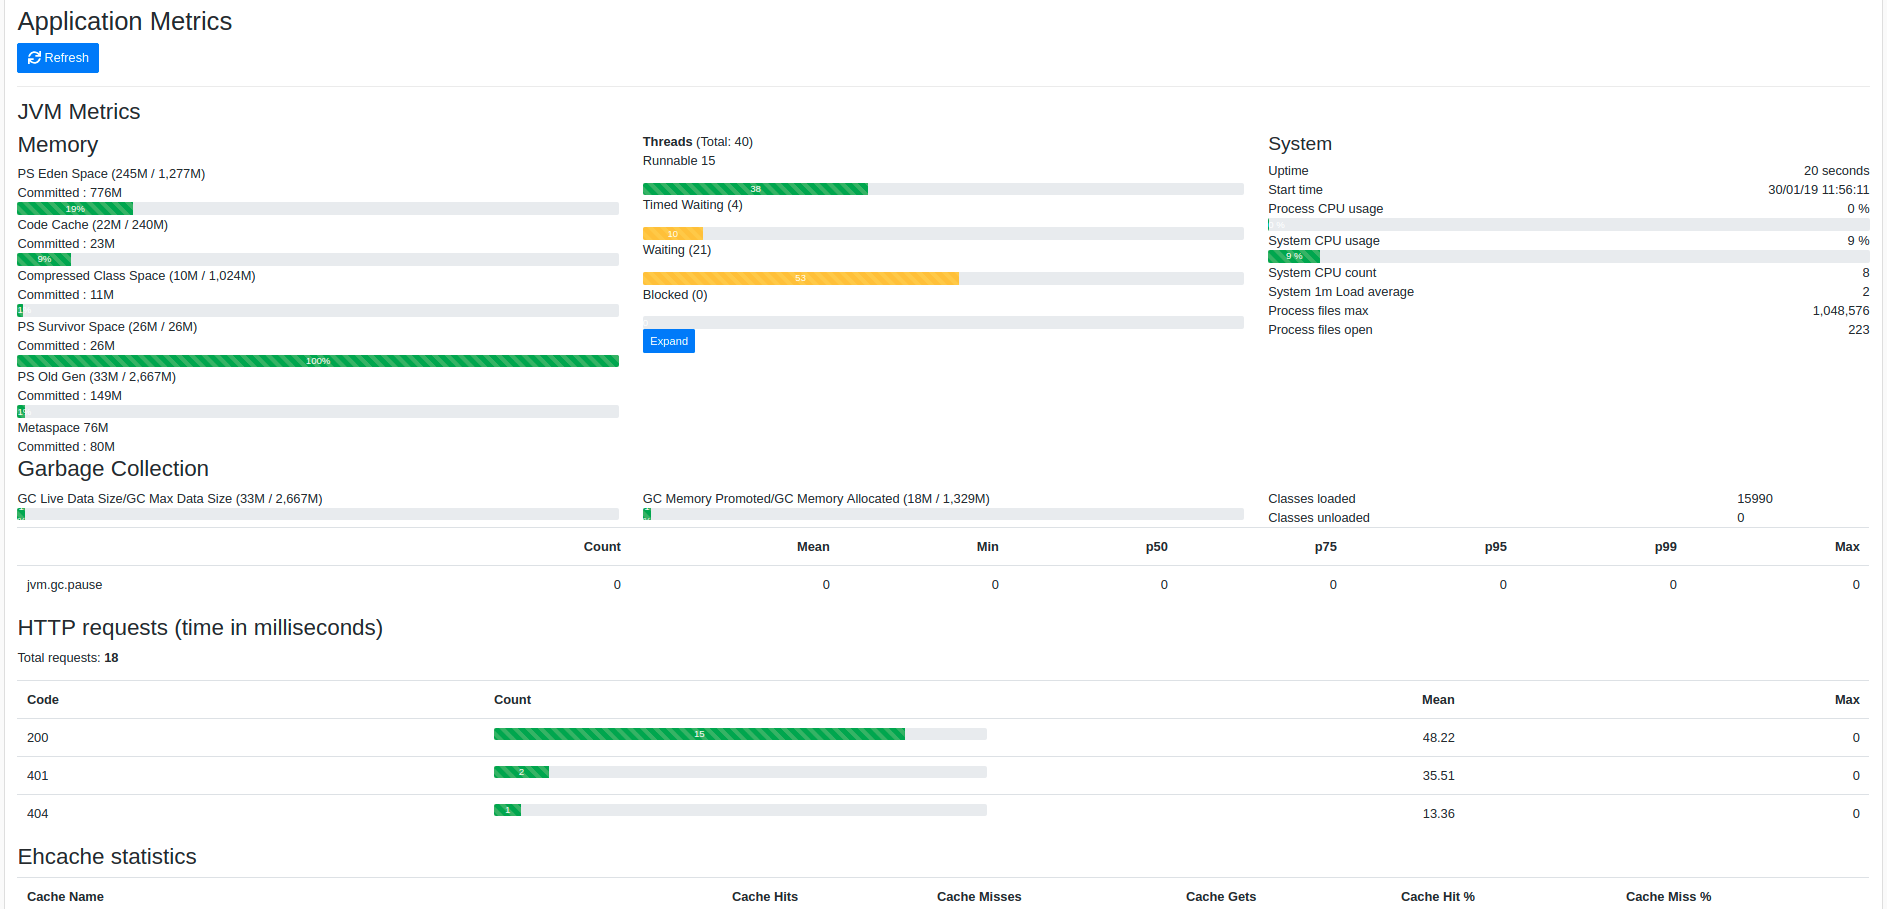
The metrics dashboard
The metrics dashboard uses Micrometer to give a detailed view of the application performance.
It gives metrics on:
- the JVM
- HTTP requests
- cache usage
- database connection pool
By clicking on the Expand button next to the JVM thread metrics, you will get a thread dump of the running application, which is very useful to find out blocked threads.
The health dashboard
The health dashboard uses Spring Boot Actuator's health endpoint to give health information on various parts of the application. Many health checks are provided out-of-the-box by Spring Boot Actuator, and you can add application-specific health checks.
The logs dashboard
The logs dashboard allows to manage at runtime the Logback configuration of the running application. You can change the log level of a Java package by clicking on a button, which is very convenient both in development and in production.
Security Metrics
JHipster tracks JWT-related security metrics in projects that uses JWT authentication type.
In particular, JHipster tracks token validation errors count (i.e. invalid tokens count) as a custom meter named security.authentication.invalid-tokens, and the causes of such validation errors with the following meter tags:
invalid-signature: the JWT signature verification has failed;expired: the JWT has expired;unsupported: the JWT format does not match the format expected by the application;malformed: the JWT was not correctly constructed.
These metrics are not available in the generated dashboards, but they are exposed as application metrics and can be forwarded to a third-party monitoring system for visualization.
JHipster Registry
The JHipster Registry has its own documentation page here.
It mostly provides the same monitoring dashboards as in the previous section, but it works on a separate server. As such, it is a bit more complex to set up, but it is highly recommended to have dashboards running outside of the running application: otherwise, they won't be available when there is an application error.
ELK (Elasticsearch, Logstash, Kibana) Stack
The ELK stack is often used for log aggregation and search, it consists of the following components:
- Elasticsearch for indexing the data (logs and metrics)
- Logstash to manage and process the logs received from the applications
- Kibana to visualize the logs with a nice interface
JHipster supports forwarding logs to Logstash, however as of JHipster version 7, we do not provide any ELK stack docker deployment and ready to use dashboards. This used to be part of the JHipster Console subproject that is no longer maintained. We advise existing users to migrate to another ELK solution.
Forwarding logs to Logstash
To configure a JHipster application to forward their logs to Logstash, enable logstash logging in their application-dev.yml or application-prod.yml:
jhipster:
    logging:
        logstash:
            enabled: true
            host: localhost
            port: 5000
            queueSize: 512
To collect those logs, on the Logstash side, a simple logstash.conf file can be provided :
input {
    tcp {
        port => "5000"
        type => syslog
        codec => json_lines
    }
}

output {
    elasticsearch {
        hosts => ["${ELASTICSEARCH_HOST}:${ELASTICSEARCH_PORT}"]
        index => "logs-%{+YYYY.MM.dd}"
    }
}
For more information on how to setup the ELK stack, please refer to the official Elastic documentation.
Forwarding metrics to a supported third party monitoring system (JMX, Prometheus)
JHipster exposes application metrics in the Prometheus format by default.
It is exposed under management/prometheus.
Forwarding metrics to alternative systems is also supported via spring boot actuator.
If you would like to disable exposing the metrics endpoint you can disable it in src/main/resources/application.yml.
management:
    prometheus:
        export:
            enabled: false
The prometheus endpoint is unprotected by default. If you want to protect it via spring security you can do so by adding basic auth to the prometheus endpoint as prometheus can work with scraping endpoint protected by basic auth.
Create a new configuration file (e.g. BasicAuthConfiguration.java).
@Configuration
@Order(1)
@ConditionalOnProperty(prefix = "management", name = "metrics.export.prometheus.enabled")
public class BasicAuthConfiguration {

    @Bean
    public SecurityFilterChain filterChain(HttpSecurity http) throws Exception {
        http
            .antMatcher("/management/prometheus/**")
            .authorizeRequests()
            .anyRequest().hasAuthority(AuthoritiesConstants.ADMIN)
            .and()
            .httpBasic().realmName("jhipster")
            .and()
            .sessionManagement()
            .sessionCreationPolicy(SessionCreationPolicy.STATELESS)
            .and().csrf().disable();
        return http.build();
    }
}
You can log in with the default admin/admin. You must add following configuration to you prometheus configuration such that prometheus can still scrape your application.
basic_auth:
    username: "admin"
    password: "admin"
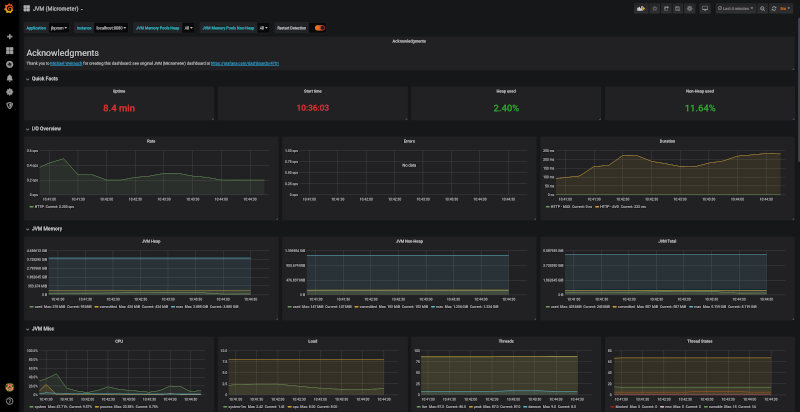
You can start a preconfigured Grafana and Prometheus instance on our local machine via docker-compose -f src/main/docker/monitoring.yml up -d to have a look at the
provisioned jvm/micrometer dashboard.
Unlike in previous JHipster versions, JHipster 5.8 metrics reporting only support JMX and Prometheus out of the box. Please have a look to the Metrics official documentation for instructions on how to setup other reporters like Graphite.
Zipkin
JHipster applications can integrate with Zipkin through Spring Boot Actuator Tracing to provide distributed tracing for your microservice architecture. To enable Zipkin tracing, package your application with the zipkin maven/gradle profile. This will trigger span reporting to the Zipkin server and also add correlation IDs (TraceId, SpanId and ParentId) to request headers and logs.
Zipkin also provide a service dependency graph feature that lets you visualize the dependencies between microservices over time.
For more information on how to setup your application to report traces to Zipkin, refer to Spring Boot Production-ready Features.