The JHipster Control Center Permalink to " The JHipster Control Center"
Overview Permalink to "Overview"
The main purpose of JHipster Control Center is to monitor and manage applications.
All its features are packaged into one external application with a modern Vue user interface. Its source code is available on GitHub under the JHipster organization at jhipster/jhipster-control-center.
Summary Permalink to "Summary"
Specific Spring profiles Permalink to " Specific Spring profiles"
The Control Center uses the usual JHipster dev and prod Spring profiles. But, to work properly, it has to be started with a spring profile corresponding to a spring cloud discovery backend.
eureka: Connect to an Eureka server and fetch its registered instances, configured in application-eureka.ymlconsul: Connect to a Consul server and fetch its registered instances, configured in application-consul.ymlstatic: Uses a static list of instances provided as properties, configured in application-static.ymlkubernetes: Configured in application-kubernetes.yml
This is very useful for microservices architectures: this is how the Control Center know which microservices are available, and which instances are up.
For all applications, including monoliths, this is how the Hazelcast distributed cache can automatically scale, see the Hazelcast cache documentation
Installation Permalink to "Installation"
Running locally Permalink to "Running locally"
-
Step 1: Run server used by Spring Cloud discovery backend Permalink to "Step 1: Run server used by Spring Cloud discovery backend"
Eureka and Consul docker-compose files exist under src/main/docker to ease testing the project (see specific spring profiles).
- for Consul: run
docker-compose -f src/main/docker/consul.yml up -d - for Eureka: run
docker-compose -f src/main/docker/jhipster-registry.yml up -d - for Kubernetes : see kubernetes documentation
- Otherwise, to use a static list of instances, you can directly go to the next step.
- for Consul: run
-
Step 2: Choose your authentication profile Permalink to "Step 2: Choose your authentication profile"
There is 2 types of authentication (see authentication mechanism):
- JWT: This is the default authentication, if you choose this one, you have to do nothing.
- OAuth2: To use OAuth2 authentication, you have to launch Keycloak. Run
docker-compose -f src/main/docker/keycloak.yml up -d
-
Step 3: Run the cloned project Permalink to "Step 3: Run the cloned project"
Run the Control Center according to the specific spring profiles you want, here are some examples:
- For development with JWT and Consul, run
./mvnw -Dspring.profiles.active=consul,dev - For development with JWT and Eureka, run
./mvnw -Dspring.profiles.active=eureka,dev - For development with JWT and a static list of instances, run
./mvnw -Dspring.profiles.active=static,dev - For development with OAuth2 and Consul, run
./mvnw -Dspring.profiles.active=consul,dev,oauth2 - For development with OAuth2 and Eureka, run
./mvnw -Dspring.profiles.active=eureka,dev,oauth2 - To just start in development run
./mvnwand in another terminal runnpm startfor hot reload of client side code
- For development with JWT and Consul, run
Running from Docker Permalink to "Running from Docker"
A container image has been made available on Docker hub. To use it, run these commands:
docker pull jhipster/jhipster-control-centerdocker run -d --name jhcc -p 7419:7419 jhipster/jhipster-control-center:latest
Architecture Permalink to "Architecture"
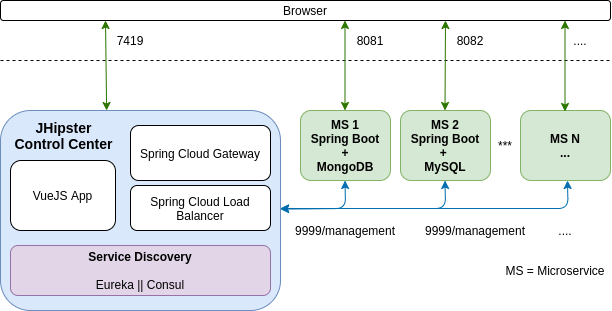
This is a standard web application that connects to one or several JHipster applications through their management API endpoints. Those management endpoints can either be exposed on the standard API port (typically 8080, 8081, …) or preferably on a dedicated management port (typically 9999) so that they are isolated from the outside world.
The Control Center use Spring Cloud Gateway for routing APIs and Spring Cloud LoadBalancer to provide client-side load-balancing in calls to another microservice (Ribbons is disabled by default to use implementation of load balancing by Spring Cloud LoadBalancer).
Authentication mechanism Permalink to "Authentication mechanism"
In order to access to your applications, the JHipster Control Center use a specific security mechanism depending on the profile.
JWT Permalink to "JWT"
This is a custom JHipster implementation. The JWT key used to sign the request should be the same for the applications and the Control Center: as by default the Control Center configures applications through Spring Cloud Config, this should work out-of-the-box, as it will send the same key to all applications.
OAuth2 Permalink to "OAuth2"
This profile use a third-party authorization - authentication server like Keycloak (or Okta soon). The Control Center will use the OAuth2 protocole to generate a session in Keycloak when you connect to the Control Center.
Then, our security configuration, in Oauth2SecurityConfiguration.java, will use Spring Security’s filter chain to get an authorization from Keycloak ang generate a Spring’s Principal (current user) with http.oauth2Login(). Afterwards, Spring Security’s filter chain will apply http.oauth2ResourceServer().jwt().jwtAuthenticationConverter(jwtAuthenticationConverter()) to get an authentication with his roles. With this way, we can change our provider (Keycloak, Okta, etc.) easly.
Features Permalink to "Features"
Instances Permalink to "Instances"
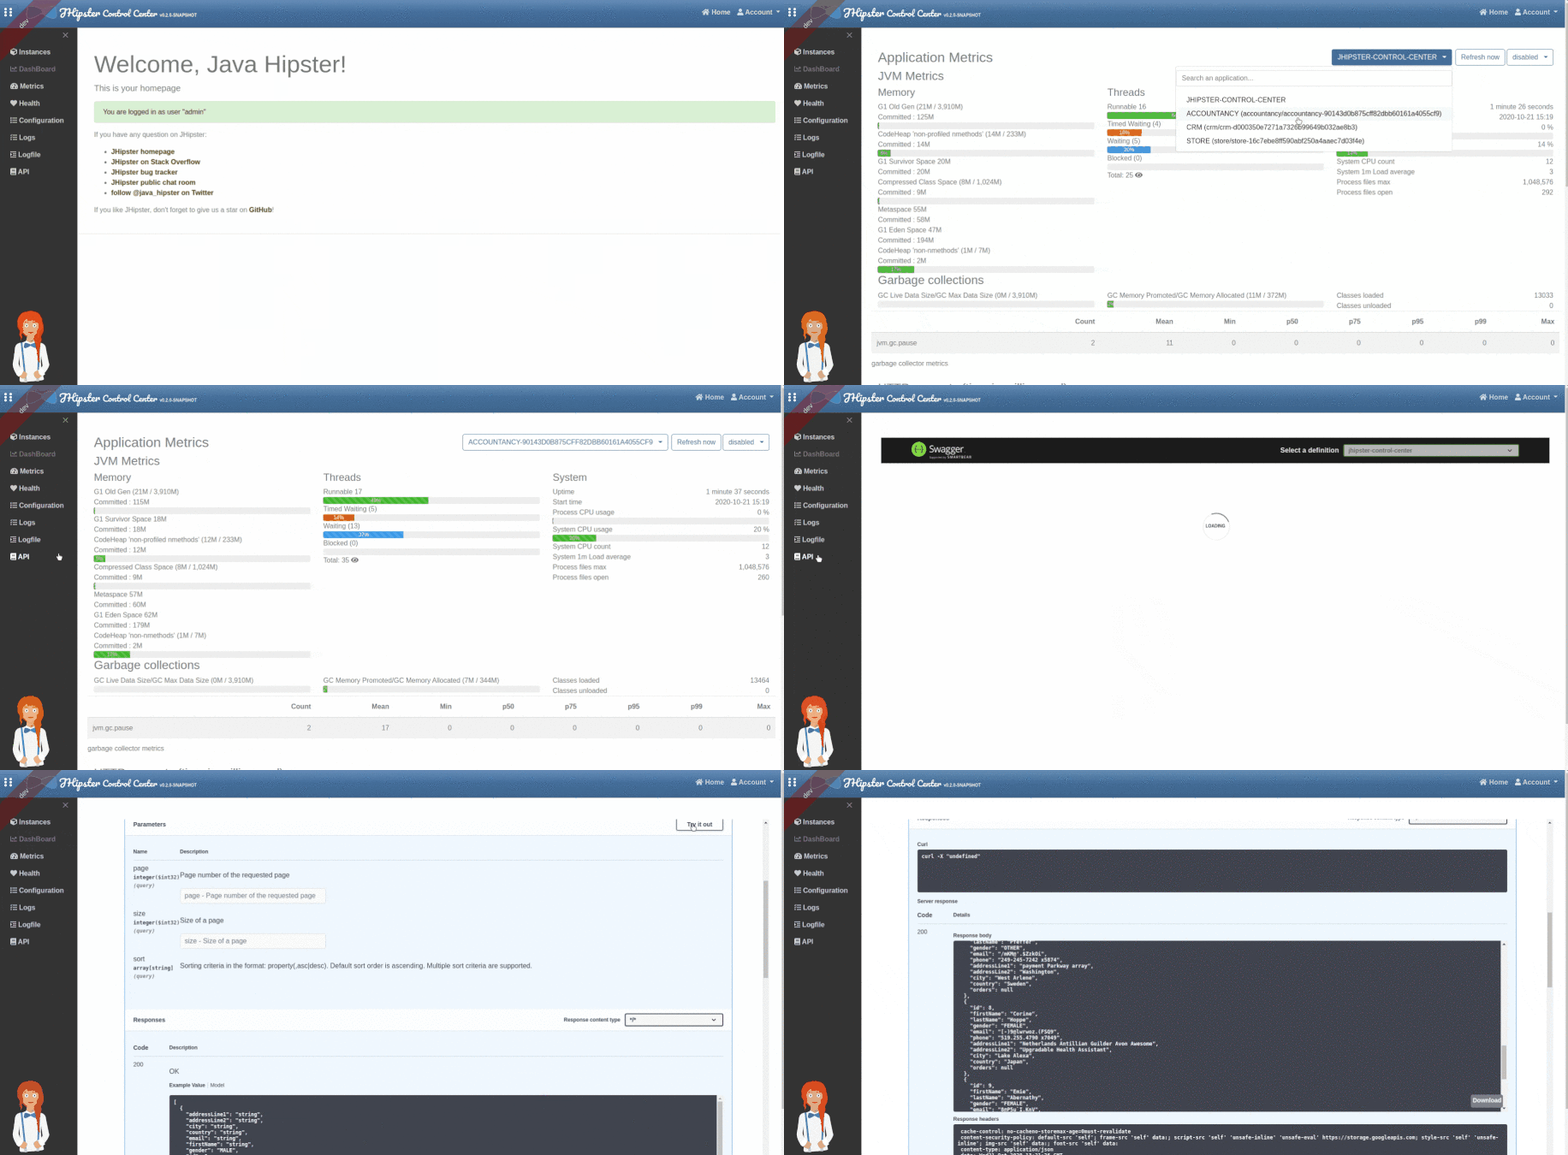
The JHipster Control Center provides a list of application’s instances. As soon as an application registers on a server (consul or eureka), it will become available in the list.

Metrics Permalink to "Metrics"
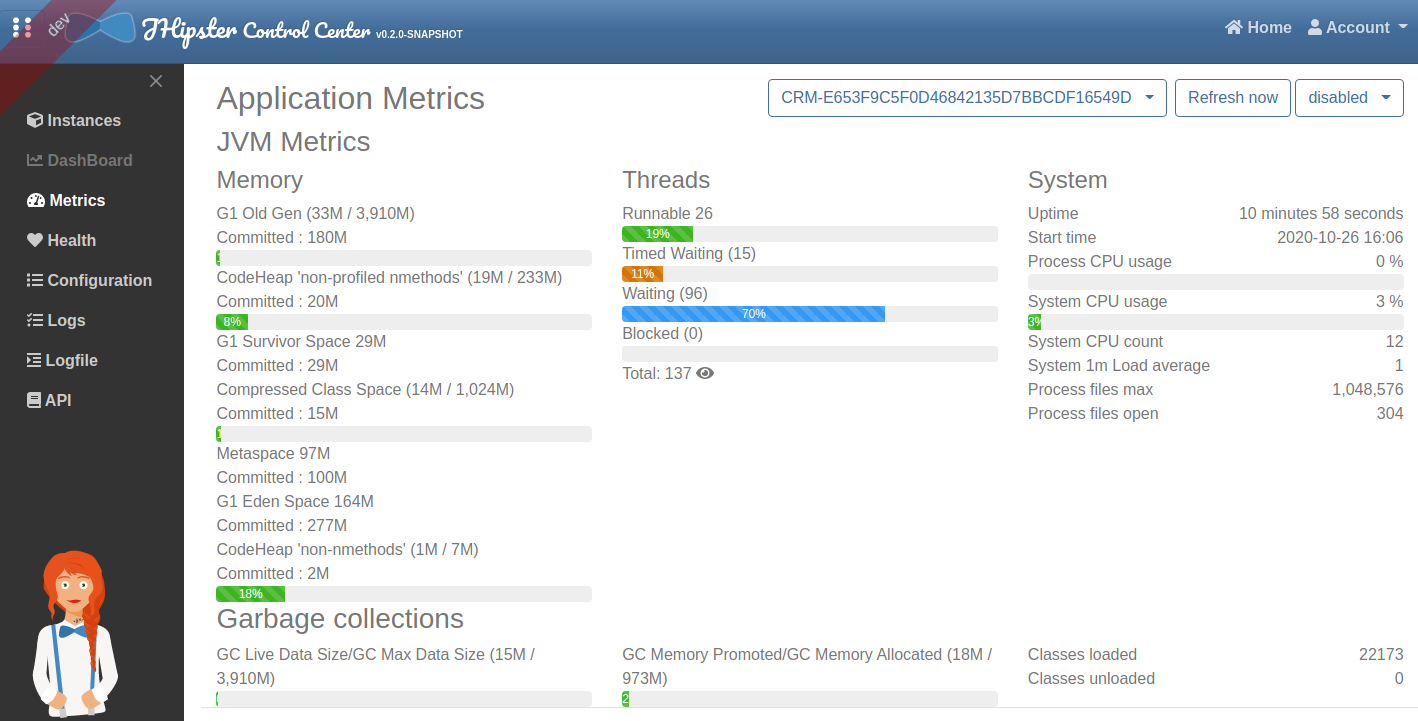
The metrics page uses Micrometer to give a detailed view of the application performance.
It gives metrics on:
- the JVM
- HTTP requests
- cache usage
- database connection pool
By clicking on the Expand button next to the JVM thread metrics, you will get a stacktrace of the running application, which is very useful to find out blocked threads.
Health Permalink to "Health"
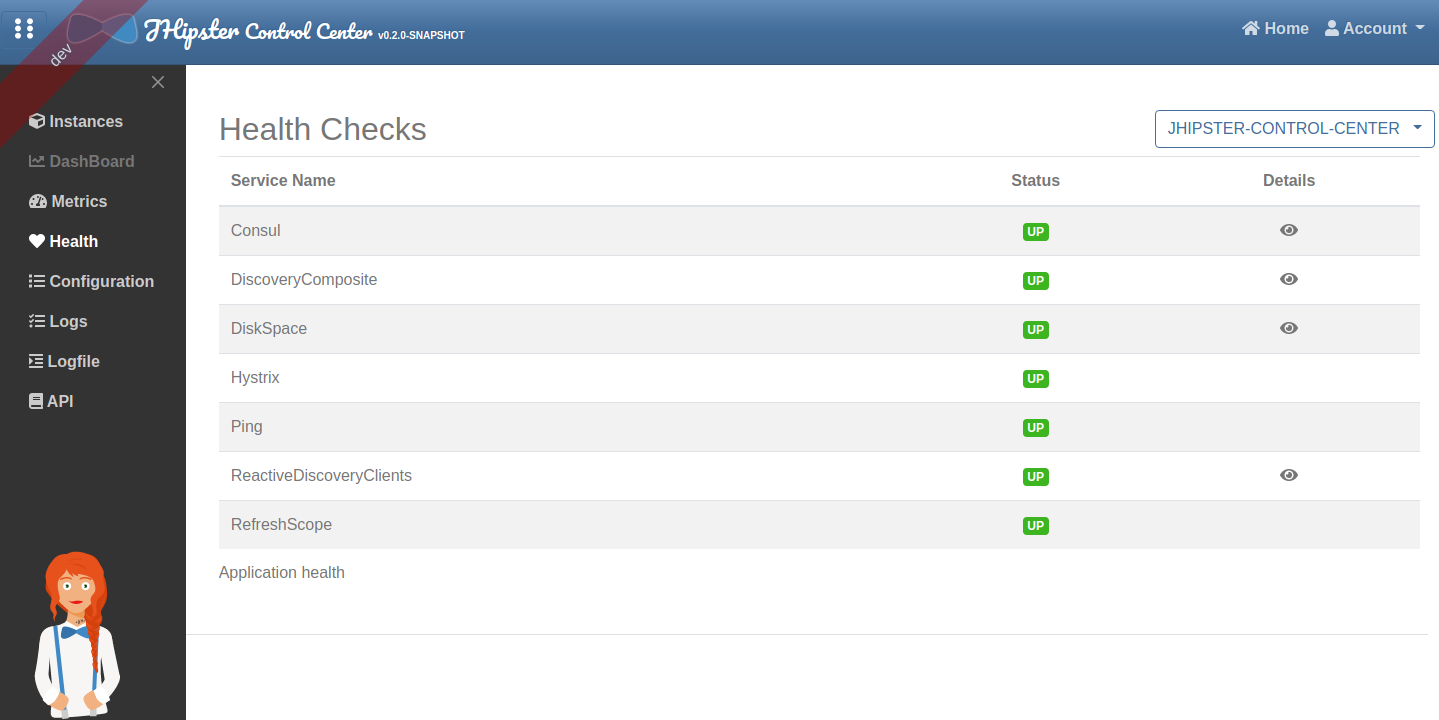
The health page uses Spring Boot Actuator’s health endpoint to give health information on various parts of the application.
Many health checks are provided out-of-the-box by Spring Boot Actuator, and you can add application-specific health checks.
Configuration Permalink to "Configuration"
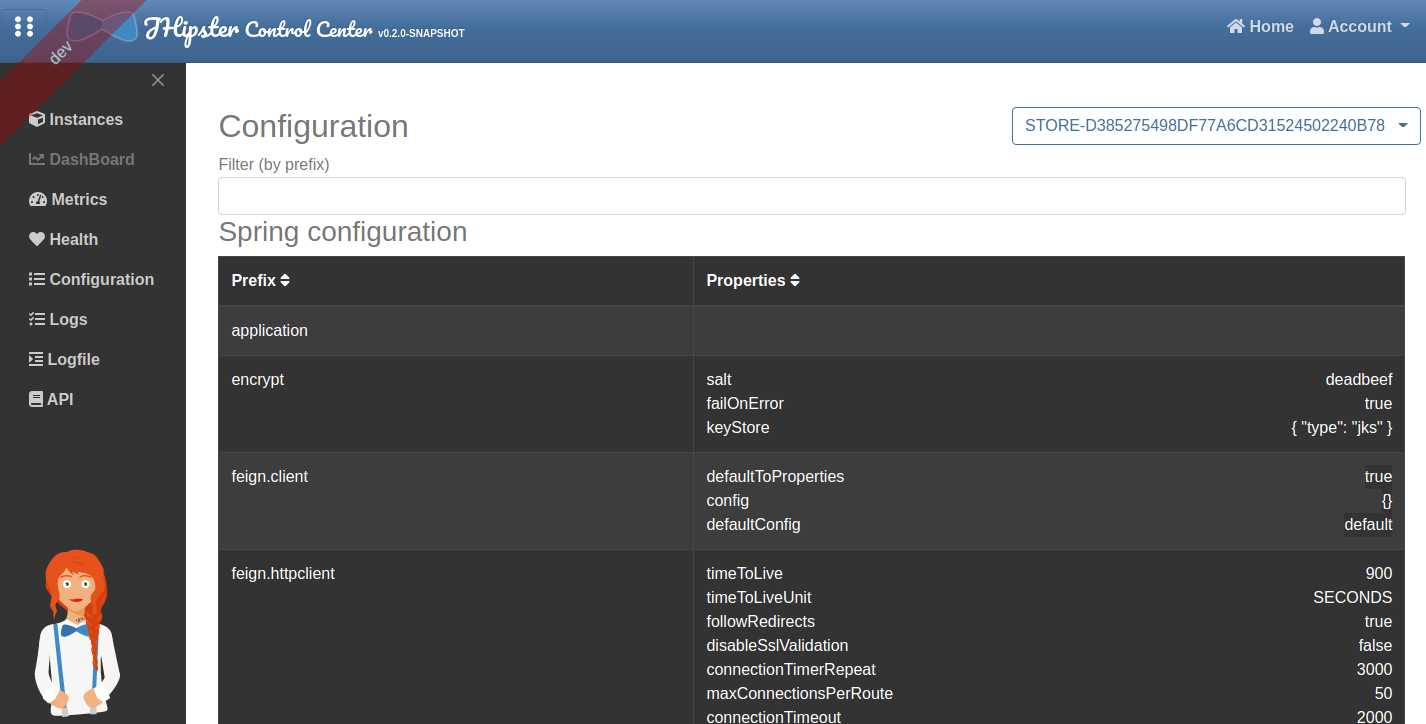
The configuration page uses Spring Boot Actuator’s configuration endpoint to give a full view of the Spring configuration of the current application.
Logs Permalink to "Logs"
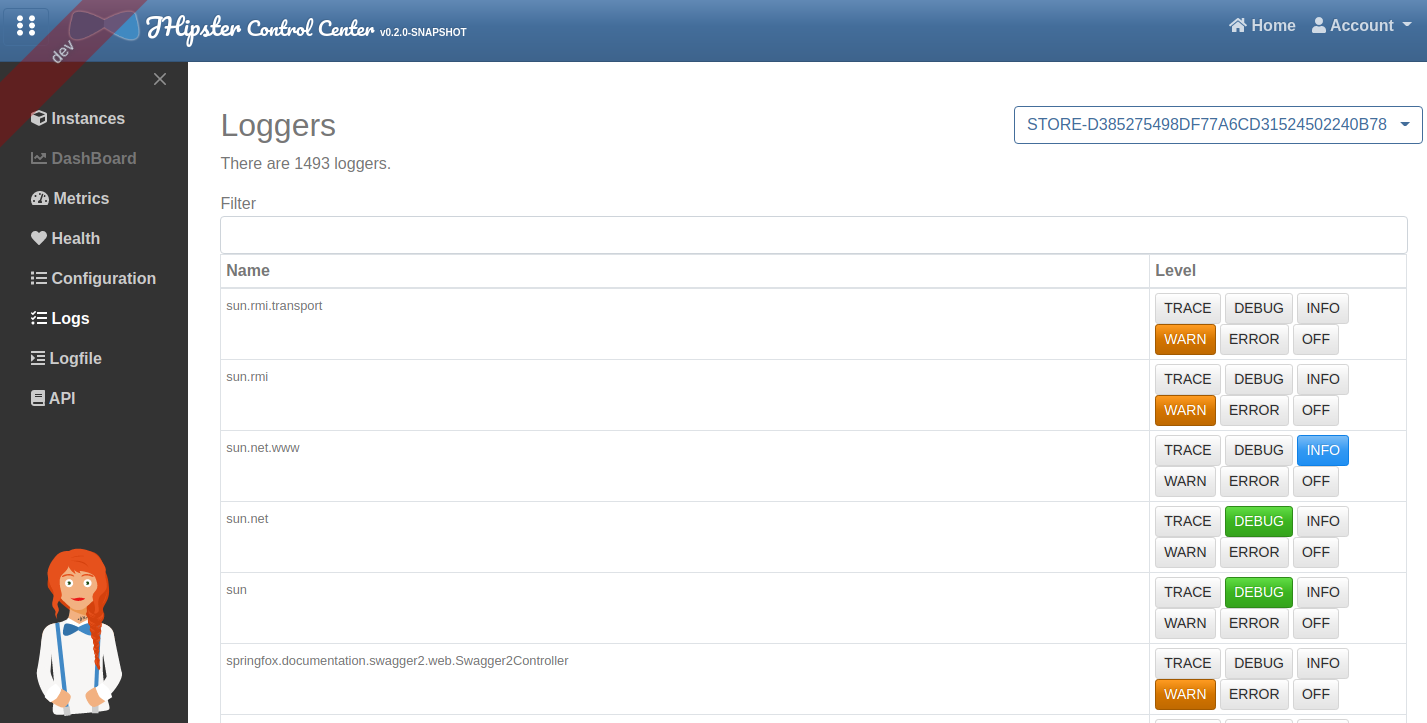
The logs page allows to manage at runtime the Logback configuration of the running application.
You can change the log level of Java package by clicking on a button, which is very convenient both in development and in production.
Logfile Permalink to "Logfile"
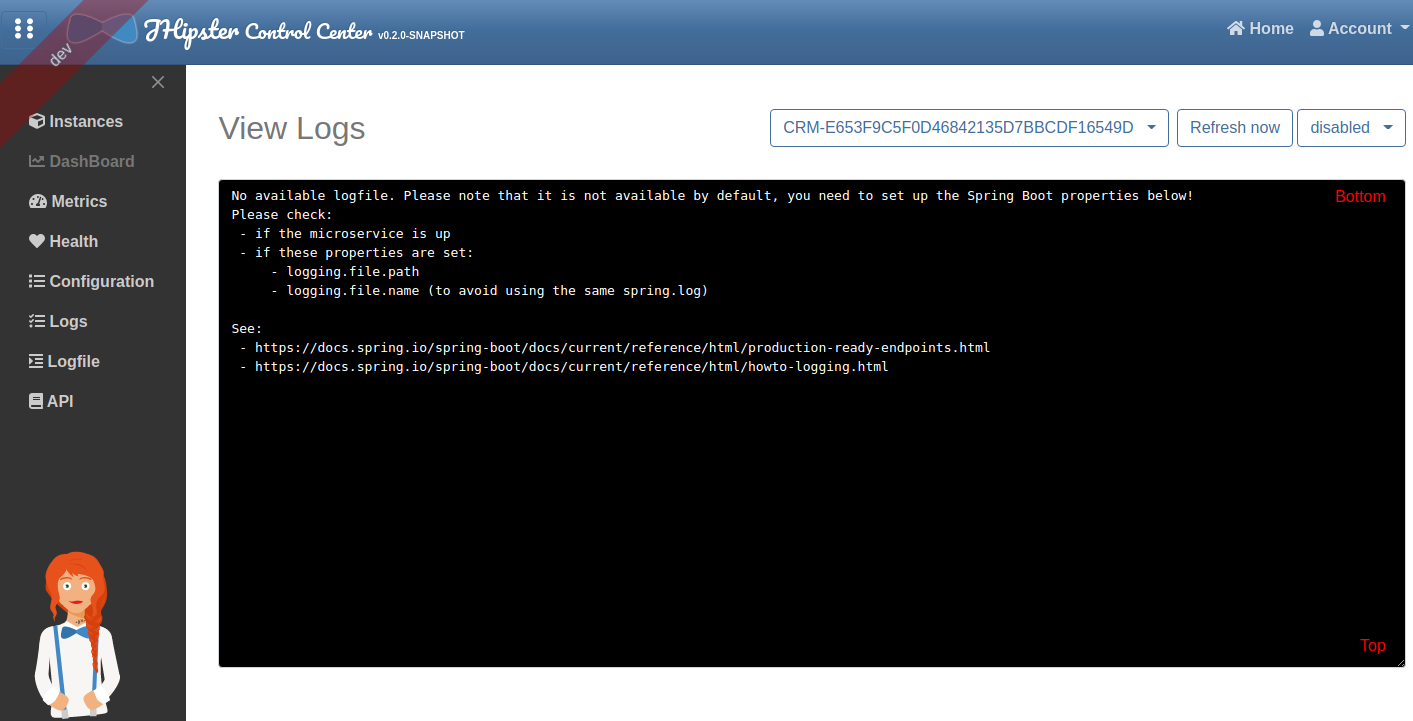
The logfile page allows to see at runtime the log of the running application. By default it is disabled, you need to configure it. This message is display if the logfile is disabled:
No available logfile. Please note that it is not available by default, you need to set up the Spring Boot properties below!
Please check:
 - if the microservice is up
 - if these properties are set:
     - logging.file.path
     - logging.file.name (to avoid using the same spring.log)

See:
 - https://docs.spring.io/spring-boot/docs/current/reference/html/production-ready-endpoints.html
 - https://docs.spring.io/spring-boot/docs/current/reference/html/howto-logging.html
API Permalink to "API"
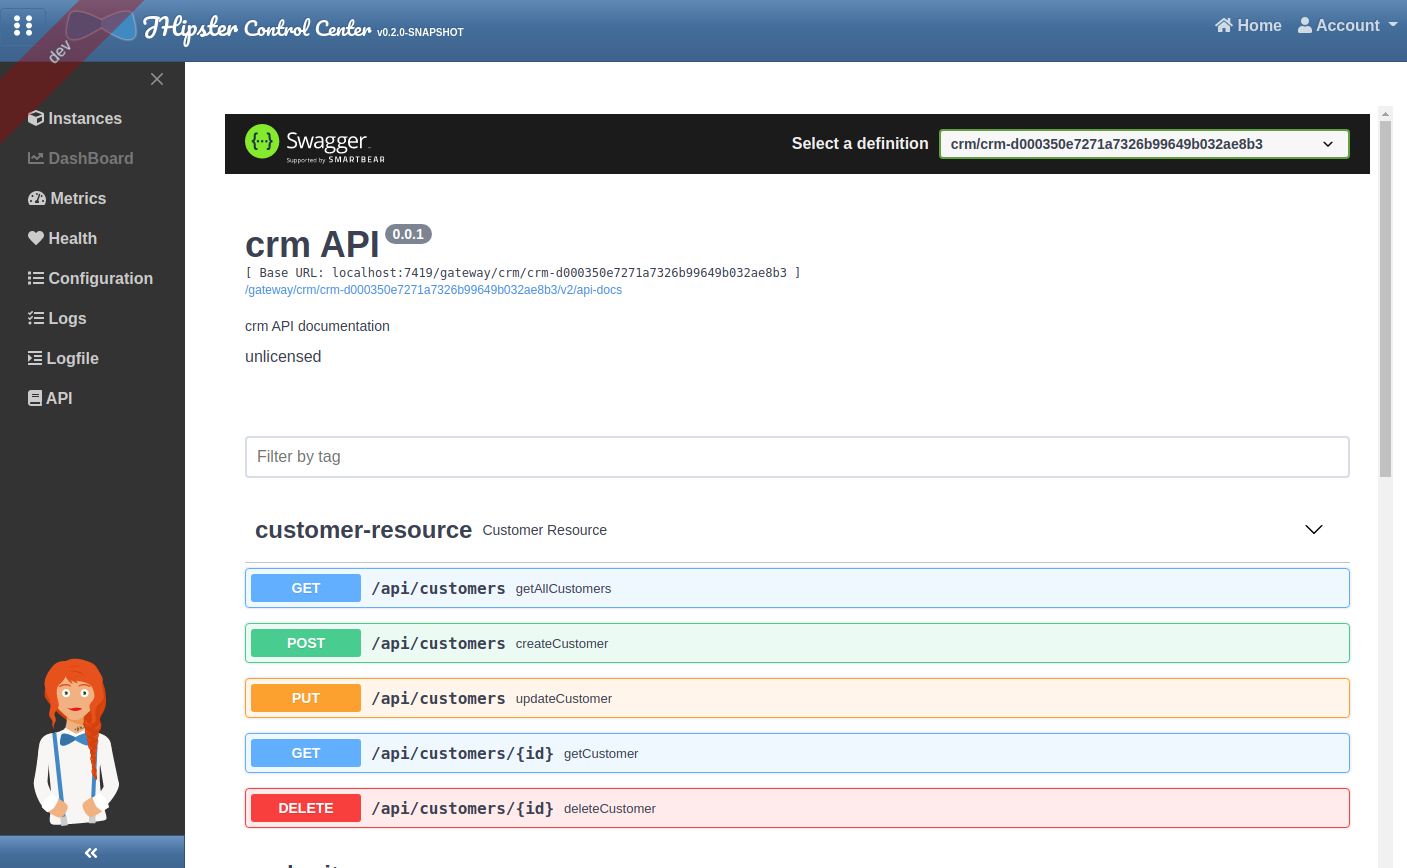
The API page allows to see all API documentation of your applications and test their endpoints through a single Swagger UI frame.
