Monitoring your JHipster Applications
JHipster provides several easy ways to get started with logs and metrics monitoring of your applications. Logs and metrics forwarding to a remote server can be set up simply by setting the relevant properties in your application.yml configuration file. Then those logs and metrics can be displayed and analyzed in real-time using a monitoring platform. Aware of the importance of monitoring your applications in production, the JHipster project offers its own monitoring solution called the JHipster Console, which is detailed below.
Configuring your apps for log and metrics forwarding to a remote server
Forwarding logs to the JHipster Console
To configure a JHipster application to forward their logs to JHipster Console, enable logstash logging in their application-dev.yml or application-prod.yml:
jhipster:
    logging:
        logstash:
            enabled: true
            host: localhost
            port: 5000
            queueSize: 512
To configure metrics monitoring, enable metrics log reporting in your JHipster application:
jhipster:
    metrics:
        logs:
            enabled: true
    	    reportFrequency: 60 # seconds
Setting those properties will enrich your logs with metrics coming from Dropwizard metrics.
Introducing the JHipster Console
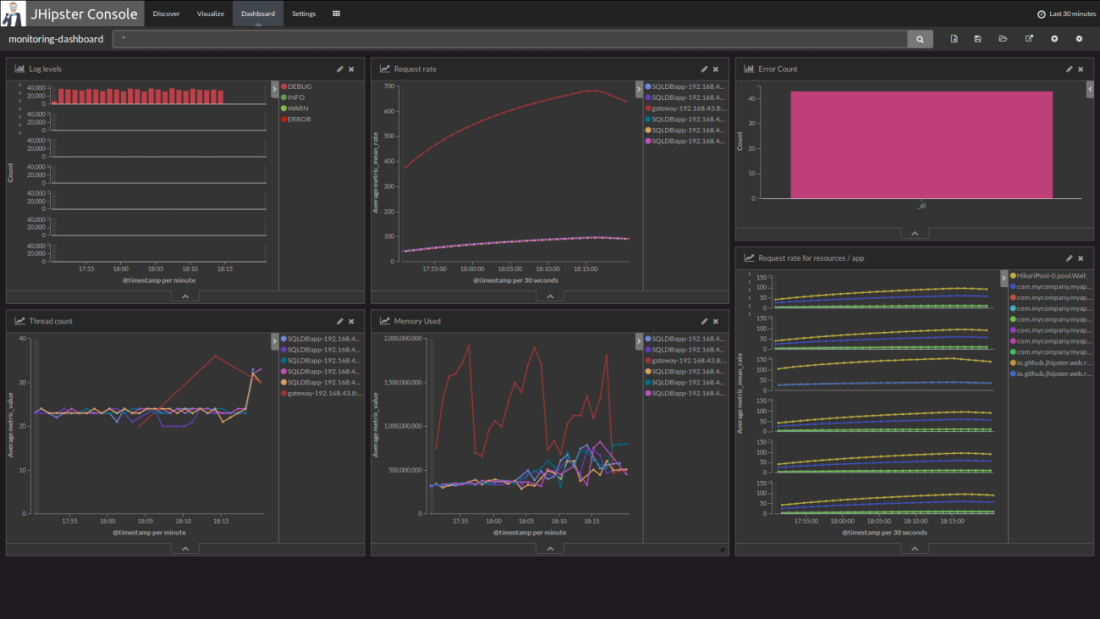
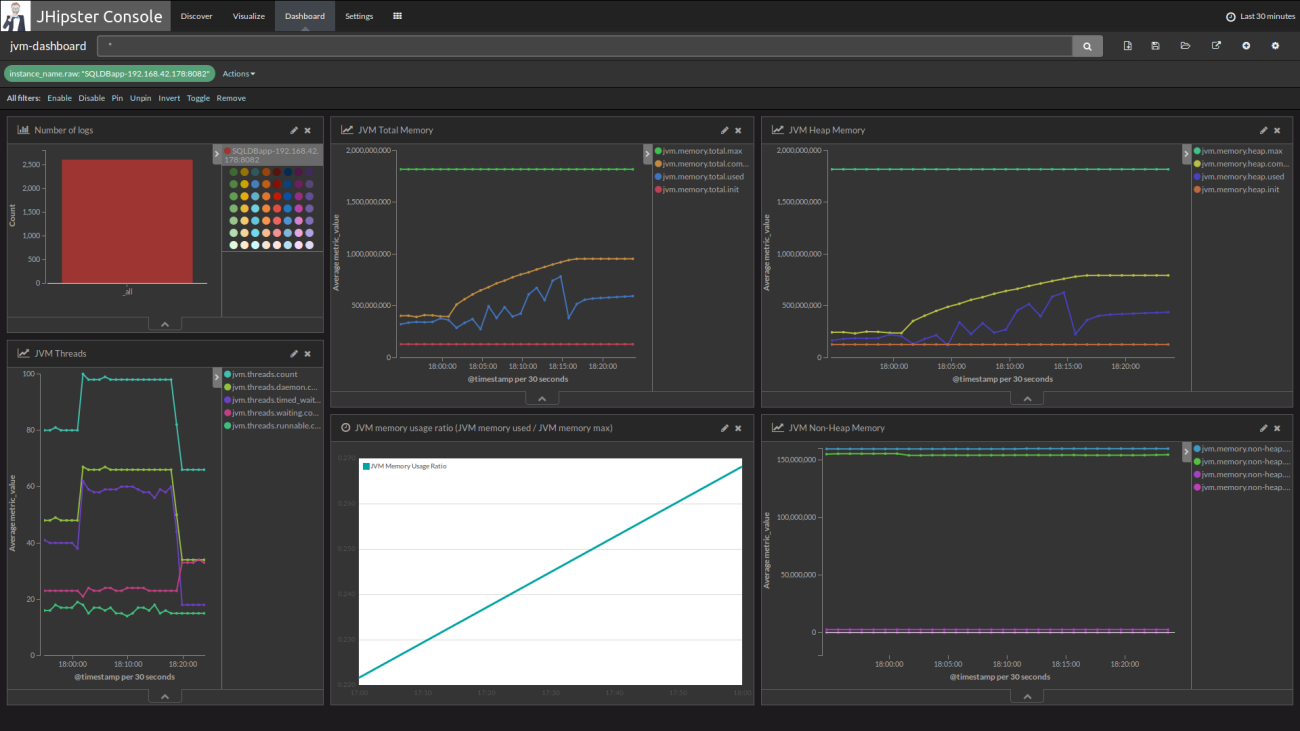
The JHipster Console is a monitoring tool based on the ELK Stack. It provides ready-to-use dashboards and analytics tools to have a real-time overview of your infrastructure’s performance.
The ELK stack is composed of:
- Elasticsearch for indexing the data (logs and metrics)
- Logstash to manage and process the logs received from the applications
- Kibana to visualize the logs with a nice interface
The JHipster Console is a Docker-based project that adds features on top of the official Elasticsearch, Logstash and Kibana Docker images. We have made a few visual changes to Kibana and set-up useful dashboards, so that you can get started to monitor your JHipster applications in minutes instead of the hours that would be needed to set up your own monitoring infrastructure.

Setting up JHipster Console
If you already have a JHipster microservice architecture set up with the Docker Compose workflow, the JHipster Console can be automatically set up by the Docker Compose sub-generator.
If you are using the monolithic version of JHipster, you will need Docker and Docker Compose installed, then you can clone JHipster Console’s git repository and run:
docker-compose up -d
It will start Elasticsearch, Logstash, Kibana and ElastAlert all at once. You will then be able to access the JHipster Console at http://localhost:5601. It should automatically receive logs from your applications if they have been correctly configured to forward their logs and metrics to Logstash.
To stop everything, run:
docker-compose stop
Once stopped, you can remove the containers if you don’t intend to start them again:
docker-compose rm
Using JHipster Console
Once your application is running with logs and metrics forwarding enabled, you can view a dashboards by clicking on the Load Saved Dashboards icon ( ) in the Dashboard tab.
You can also use Kibana’s Discover and Visualize tabs to explore your data and create new visualizations. To understand how to use Kibana’s interface effectively please refer to its official documentation in particular the Discover, Visualize and Dashboard sections of the Kibana User Guide.

Data persistence with docker volumes
When using JHipster Console you can enable docker volumes in the docker-compose.yml file by uncommenting the appropriate lines. Those volumes are used to share data between containers and the host. They will persist data and configuration even if containers are removed from your system.
- Elasticsearch has its data saved to
log-monitoring/log-data - Logstash loads its configuration from
log-monitoring/log-config/logstash.conf, you can edit this file to add new parsing rules for data received by logstash on UDP port 5000. - Kibana loads dashboards description files in
jhipster-console/dashboardson each startup.
Save your custom searches, visualizations and dashboards as JSON for auto import
Searches, visualization and dashboards created in Kibana can be exported using the Settings > Objects menu.
You can then extract the JSON description of a specific object under the _source field of the export.json file.
You can then put this data in a JSON file in one of the jhipster-console/dashboards sub-folder for auto-import.
If you have created useful dashboards and visualizations for your JHipster applications please consider contributing those back to the community by submitting a Pull Request on the JHipster Console’s GitHub project.
Alerting with Elastalert
JHipster Console comes with built-in alerting by integrating Elastalert, an alerting system that can generate alerts from data in Elasticsearch. Elastalert is simple to use and able to define complex alerting rules to detect failures, spikes or any pattern based on an Elasticsearch Query.
Enable alerting
To enable alerting, add the following lines for the jhipster-console service in docker-compose.yml.
environment:
    - ENABLE_ALERTING=true
volumes:
    - ./alerts/config.yaml:/opt/elastalert/config.yaml
    - ./alerts/rules/:/opt/elastalert/rules
Configure alerting
Elastalert configuration can be modified in alerts/config.yaml. For example, you can configure the alerting frequency and the buffer period, by changing the following properties:
run_every:
    minutes: 1
buffer_time:
    minutes: 5
Then you will need to write some rules that define when alerts will be thrown.
Write alertings rules
To define new alerts, add new YAML rule files in alerts/rules and then test them over past data with:
./test-alerting-rule.sh rule.yaml
Note that those YAML files should have a .yaml file extension. Read more on how to write rules at Elastalert’s official documentation.
Alerting dashboard
Go to localhost:5601/app/kibana#/dashboard/alerting-dashboard to see the history of all your alerts.